
Fleet Launch & ROI Calculator
Model your fleet budget, unit economics, monthly platform fees, and projected payback period in minutes.
What would you like to invest?
Illustrative scooter-sharing plan · NGN reference market. All costs are pre-filled estimates. You can change every assumption below.
No signup. No commitment. Calculations stay on your device.
Here's one way to put it to work.
An estimated starting plan, not a supplier quotation or promised return.
15 scooters
Scooters, with launch costs and cash reserve funded
₦3M
Average of first 12 months, including closures; after modeled costs
+190%
Net cash return on your entire budget; not annualised
6.1 mo
Recovers capital in month 7
At 60% demand pace, your fleet reaches full capital break-even within 6.1 months. Monthly costs scale with fleet size.
Where your budget goes
Fund the foundations first. Put the balance into vehicles and a reserve.
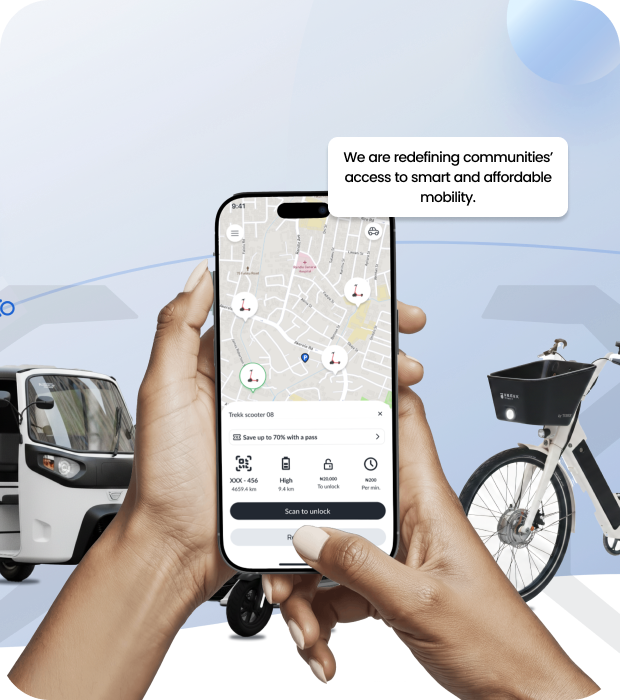
Your brand. A practical first fleet.
The reference is shared electric scooters. E-bikes, mopeds, and commercial cargo fleets require different procurement and operating parameters.
How much demand should we plan for?
Choose a share of Scoot Easy's reported average ride activity.
Selected pace: approximately 302 rides per scooter per open month (10.1/day); before launch ramp. 10 open operating months/year; fixed costs continue in closures.
Watch capital work over time
CUMULATIVE CASHMonth 0 deducts your full budget (₦25,000,000). The final month includes the modeled release of your cash reserve buffer and any entered residual vehicle value.
A closer look at the economics
Break-even is before tax and initial capital recovery. Revenue is not profit. Returns are unlevered project estimates based on live operator benchmarks.
A reference you can see.
Scoot Easy at Afe Babalola University, Nigeria. Management-reported results over approximately two months following its launch.
15
scooters15,100
reported rides₦16.6m
reported revenueWe use this to anchor ride activity and purchase cost — not to assume every location will perform the same way. Reference averages: approximately 503 rides and ₦553,333 revenue per scooter per month, and ₦1,099 per ride. Vehicle purchase reference: $709 per scooter, converted at historical rates supplied for that purchase.
Make the next step a real conversation.
Your budget is a starting point. Let's validate the vehicles, location, commercial terms and operating plan behind it.
Simple to use. Open about the assumptions.
Budget to fleet
We reserve your selected share of the budget, deduct fixed launch and Basic technology setup costs, then round down to whole scooters using the landed per-scooter allowance. Any remainder stays in the cash reserve. The Basic plan is capped at 500 vehicles in this model. The full budget is treated as committed project capital.
Current price reference
The Trekk pricing page lists Basic setup at ₦5,334,000 ($4,000) and monthly per-vehicle bands of ₦10,667 for 1–100 vehicles and ₦9,334 for 101–500 vehicles. Its published/indexed minimum reference is €480; the starter minimum allowance is approximately ₦755,393, derived using the page's indicative NGN/EUR ratio.
Activity to cash
Revenue uses Scoot Easy's average rides per deployed scooter, your selected demand share, fare and operating days. The reference already includes whatever downtime occurred; no extra availability haircut is automatically applied. Open months are modeled as 10 months each year; fixed operating costs continue during closures.
Returns and tax
Monthly cash deducts illustrative operating costs and a simplified tax estimate on positive profit after straight-line allocation of startup spending over useful life. Payback is the first cumulative recovery crossing. Additional funding is flagged when the worst cumulative operating deficit exceeds the reserve.
A starting point, not a promise.
This tool produces preliminary, illustrative estimates from a budget, selected assumptions and management-reported Scoot Easy reference data. Scoot Easy's experience is not evidence that a new site will achieve similar demand, costs or returns. Logistics, charging and operating allowances are assumptions, not supplier quotations or verified customer expenses. Basic is Trekk's lowest published tier; other packages, hardware, support, integration, taxes and monthly minimums may change the cost.